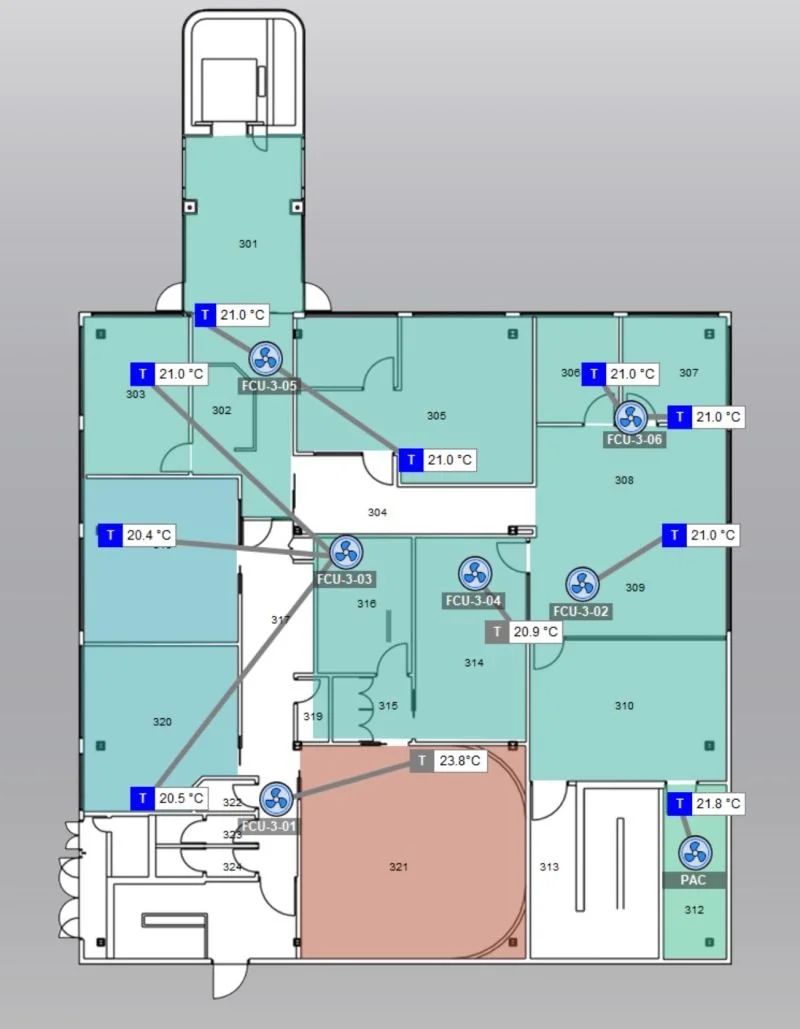
Thermal overlays on BMS floorplan graphics
Thermal overlays on BMS floorplan graphics are one of the most useful visual tools for understanding how a floor is performing.
Some items it surfaces when implemented correctly:
✅ Heating and cooling outputs that needs further tuning by the BMS contractor - improve tenant comfort
✅ Help identify patterns in problem areas
✅ Impact of solar heat loads
✅ Zone demarcation, so a complaint maps straight to the unit serving that area. Faster fault finding, lower OPEX costs.
The catch is that in a race to the bottom pricing culture, this kind of feature is usually one of the many things cut. Which is a shame, because the cost to add it is minimal next to the value it returns, and the people it helps most are the people who manage the building.
For me it's an interesting turn of events. Early on in my career on new build projects I used to undervalue and hate adding these objects. After several years working alongside building operators and optimising building portfolios, I've become an advocate.
The argument against this feature is that you can tune effectively from a standard summary page (matrix style format), but I politely disagree. In addition to the above, thermal overlays give spatial context on how adjacent equipment operate together. Most summary pages are ordered ascending/descending, which isn't necessarily a reflection of how the system is actually installed in the field.